2026LiveSolo full-stack developer
Stock Market Trend Dashboard
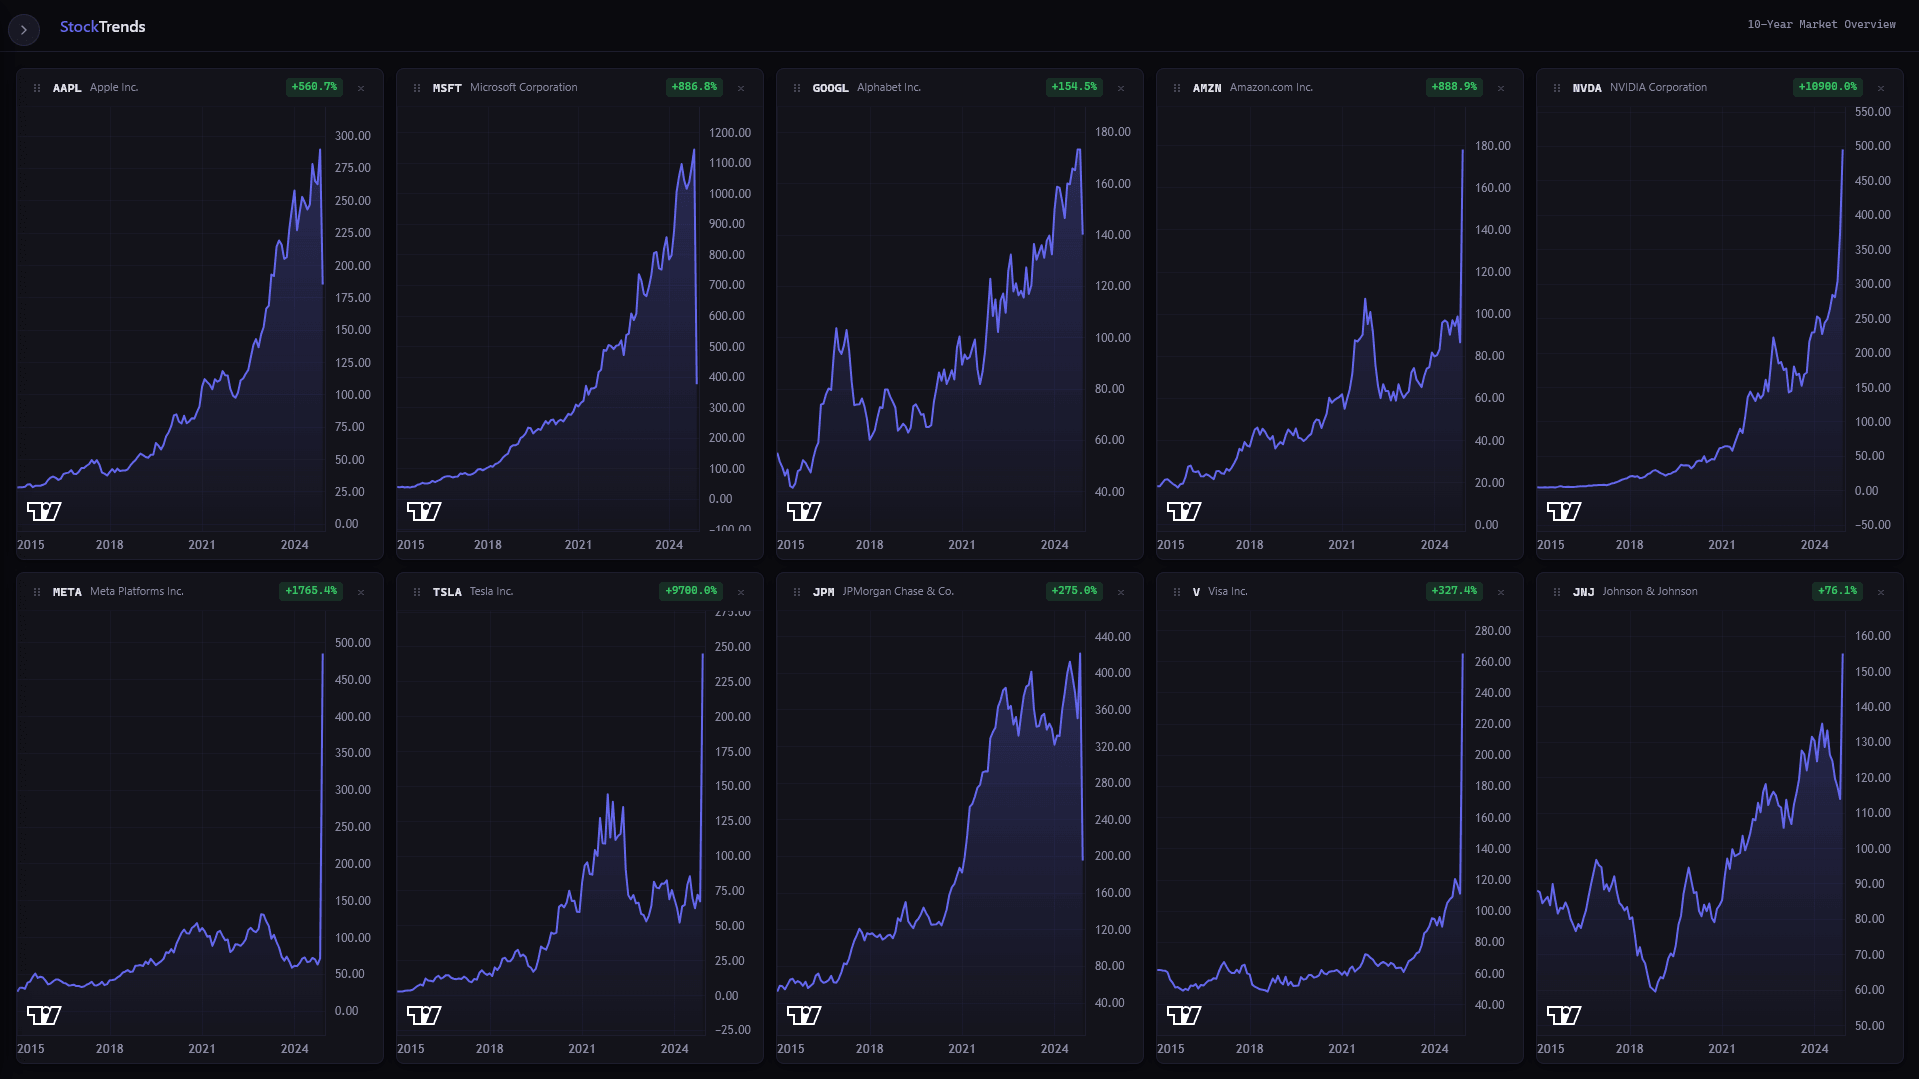
A dark-mode grid of 10-year trend charts built on TradingView Lightweight Charts, with a draggable layout and a FastAPI backend.
ReactTypeScriptViteTradingViewFastAPIPythonDocker
Overview
A stock trend dashboard that renders 10-year price charts for a user-picked set of tickers in a draggable 5-by-2 grid. The frontend is React, TypeScript, and Vite using TradingView Lightweight Charts for rendering and dnd-kit for the drag-to-reorder layout. The FastAPI backend ships bundled mock data by default; live data is optional via an Alpha Vantage API key. Everything runs in Docker Compose locally and deploys to Vercel.
Highlights
- 10-year trend charts via TradingView Lightweight Charts, chosen for their render performance over custom SVG.
- Searchable side panel with checkbox selection, overflow scrolling past the first ten picks.
- Draggable 5-by-2 grid powered by dnd-kit so the layout follows the user's priorities.
- Bundled mock dataset for offline use, with Alpha Vantage as an optional live provider.
Challenges and approach
- Reordering charts while maintaining their rendered state required holding chart instances stable across drag events rather than remounting them on reorder.
- Offering both offline mock mode and live Alpha Vantage mode without branching the UI meant the backend normalizes both sources into the same shape before serving.